In this article I’m going to share with you the tools that I’ve found useful as a beginner making decisions with my cryptocurrency. I’ve been trading for a few years now, and have used many different technical analysis, or TA, tools to get a picture of what could happen next. There are so many different tools out there, that it’s hard to know which ones are good and which ones aren’t. It makes sense to know what type of tools you need before you dive into something you don’t understand.
History Behind Technical Analysis:
Technical analysis has been around for hundreds of years. It was popularized by Charles Dow in the late 19th century. It was then used by Jesse Livermore in his trading strategy, which he called “The Game.” The term “technical analysis” was coined by Richard Wyckoff, who published two books on the subject: “Stock Market Technique” (1938) and “Profits in the Stock Market” (1940). Wyckoff believed that markets were governed by mass psychology, which he believed could be studied through analyzing historical price data. He also believed that prices would tend to return to their mean values over time. This became known as the law of averages or mean reversion.
Technical Analysis vs Fundamental Analysis:
The primary goal of technical analysis is to use past information on price and volume to forecast future trends and make trading decisions. Technical analysts believe these past movements can be used as a guide for future movements in an asset’s price.
In contrast, fundamental analysis is an investment analysis technique focused on economic factors such as company earnings, industry trends and macroeconomic conditions to forecast the value of securities or commodities over time.
Top Technical Analysis Indicators for Beginners:
Moving averages:
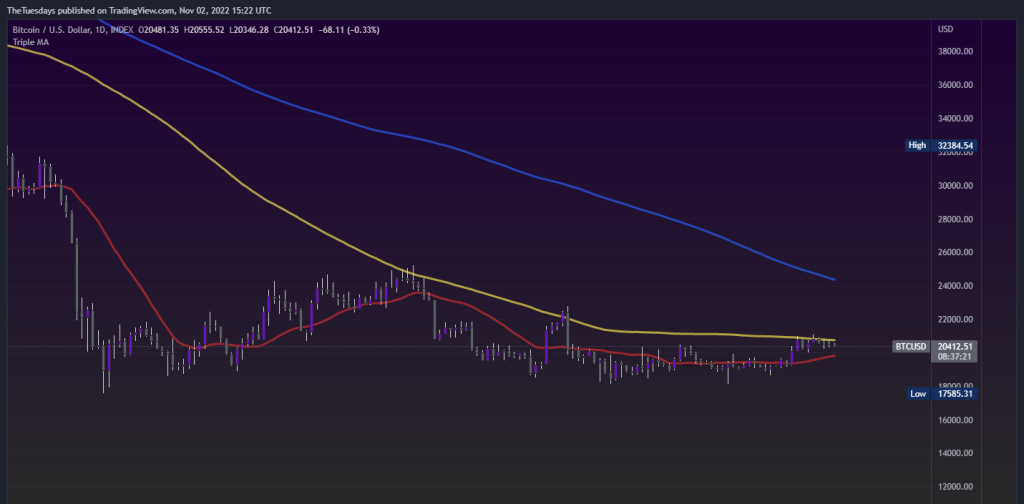
Moving averages are lines that connect data points taken at regular intervals, like every day or every hour. When traders look at moving averages, they’re trying to spot trends. For example, if a stock’s price is below its moving average and above its 200-day moving average, it might be a good time to buy. Below the Red line represents a 20 Day Moving Average, the Yellow a 100 day and Blue 200 day.
Support and Resistance Levels:
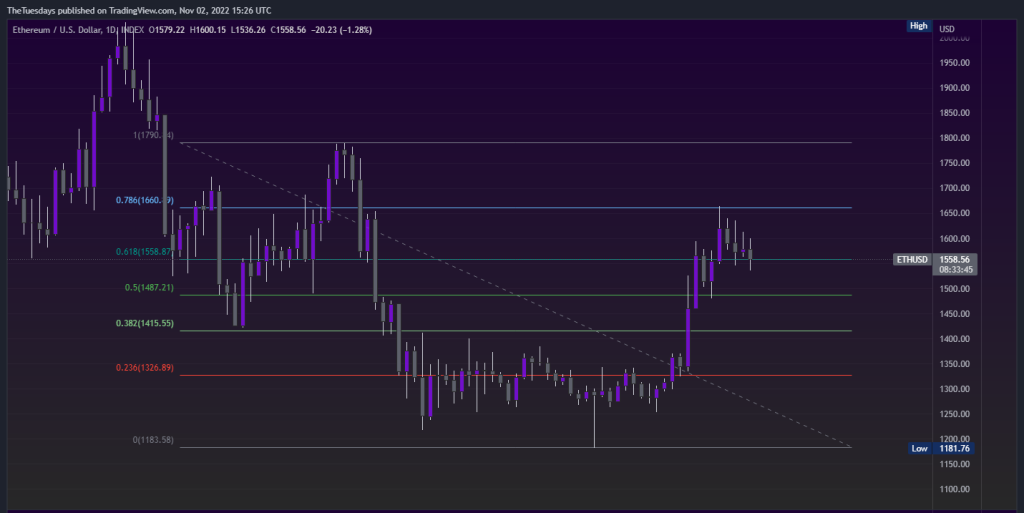
These levels are determined by analyzing previous price action on a chart and identifying specific areas where the price has been rejected in the past. They represent places where buyers come in to support the price at key levels and where sellers come in to reject price movement at key levels, causing temporary price consolidation before resuming its original direction. Below the support and resistance levels are drawn out using a Fibonacci Retracement tool. You can select the highest trading point on a chart and the lowest trading point on a chart and it will show you potential support and resistance levels.
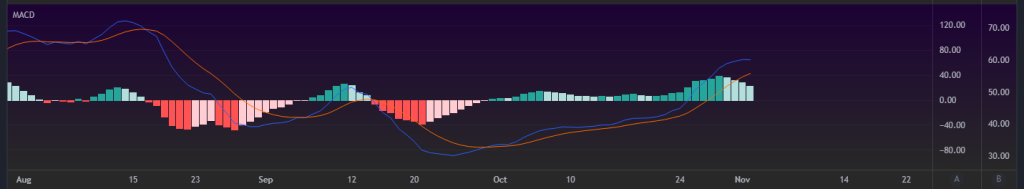
MACD (moving average convergence divergence):
The MACD indicator shows how two exponential moving averages — one short-term and one long-term — react to changes in an asset’s price. An upward crossover occurs when the short-term MA crosses above the long-term MA; this indicates that buying pressure is strong enough for prices to rise even higher. A downward crossover occurs when the short-term MA crosses below the long-term MA; this indicates that selling pressure is strong enough for prices to fall even lower. The images below shows the MACD indicator which when the blue line represents the short-term MA and orange represents long term MA.
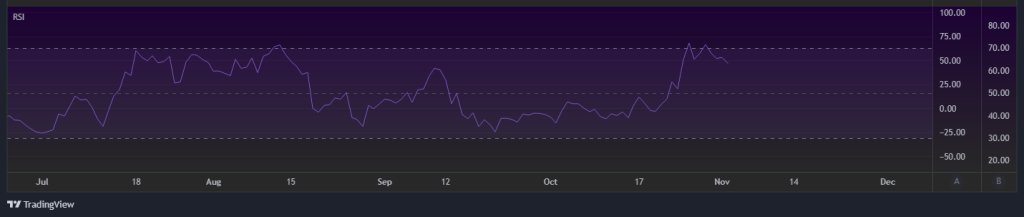
RSI:
Relative Strength Index measures both upward and downward momentum over a given time period. RSI is useful for spotting oversold or overbought conditions in order to identify potential reversal points in trend direction – buy low sell high!
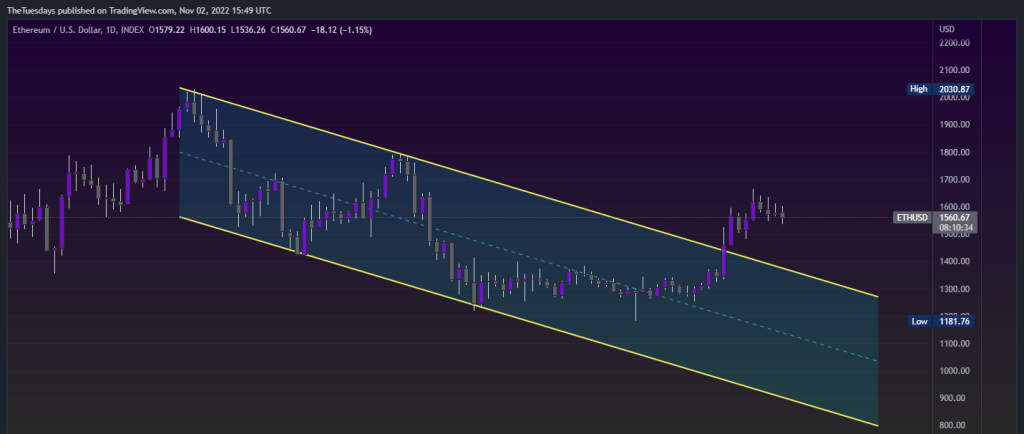
Trend Lines:
Trend lines are created by connecting two or more points on a chart that represent significant highs or lows over time. A trend line represents historical buying pressure or selling pressure that may indicate future direction for an asset’s price movement within an uptrend or downtrend channel. In the chart below you can see that ETH was in a downward trendline for weeks prior to having a breakout. This breakout has the chance to form a new channel if it continues trading upwards.
Success Rate of Technical Analysis
The success rate of technical analysis is difficult to measure. There have been many studies on the topic, but they have not yielded conclusive results.
The reason is that there are many different ways of using technical analysis. Each approach has its own strengths and weaknesses. In general, however, it can be said that technical analysis has a positive effect on trading results. In particular, it helps traders avoid making mistakes based solely on their emotions or gut feeling when making decisions about buying or selling cryptocurrency.
Some studies have shown that technical analysis can improve returns by up to 30%. Other studies show that it can improve returns by only 5% at best — but this is still significant compared with other investment strategies such as buy-and-hold investing (whereby investors buy stocks and hold them for years).
Mistakes People Make When Using TA
Mistake #1: Overlooking fundamentals
Technical analysis is based on historical pricing data, so if you’re using it to make decisions about current or future prices, you’ll need to make sure that you’re using the right information. If you’re making predictions about where a stock or crypto will go next week or next month, you should focus on factors such as company earnings reports or other news events regarding the company or project.
Mistake #2: Using too many indicators
There are thousands of different technical indicators available for traders to use when analyzing stocks or commodities. Some of these indicators are simple mathematical calculations that don’t provide any real insight. Others can offer valuable insights into potential trading opportunities. But using too many can make it hard to know what is actually going on. Sometimes simplicity is best.
Best Technical Analysis Books For Learning
There are thousands of books on the market that promise to teach you how to trade. Here are some of the best books on technical analysis:
Technical Analysis Explained by Martin Pring
Market Wizards by Jack Schwager
Technical Analysis: The Complete Resource for Financial Market Technicians by Andrew Aziz
The Encyclopedia of Technical Market Indicators by John Murphy
Technical Analysis Using Multiple Timeframes: Advanced Strategies for Generating Trading Opportunities by Steve Sosnick and Tim Larkin
Trading with Candlesticks: A Dynamic Approach to Profitable Candlestick Trading by Steve Nison
Online Resources for Learning TA
One of the best YouTube channels that I have found to learn Technical Analysis is Krown Crypto. His channel is great for beginners. It covers basics like how to read candlesticks. But also has more complex content like how to scalp trades and trading strategies.
Conclusion:
Technical analysis is one of the most effective tools that you can use when trading in cryptocurrency. It is an excellent way of reading the charts and understanding the market better. This will help you to make more accurate decisions to improve your profits. If you have done your research and feel confident about committing to a long-term investment, then technical analysis can certainly help you make smart trades.
If you’re just getting start join our discord and ask questions. There is always someone active that would be willing to show what indicators they like using. Along with how those indicators work. Come and be apart of the community and stay up to date with everything going on in crypto and other markets.